Back to Projects
Well Data Search
Our team worked with an international oil field services firm to develop a tool to give analysts access to project data worldwide. The project team used DevExtreme for the UI pattern library, and Leaflet for the interactive map.
MY ROLE: principal UX Designer, Visual Designer, and lead presenter to stakeholders. I used Balsamiq for low-fidelity prototypes in the early going, and Adobe Photoshop and Illustrator for the high-fidelity prototypes shown here. I have since transitioned to Adobe XD for wireframes and prototypes.
Home Screen:
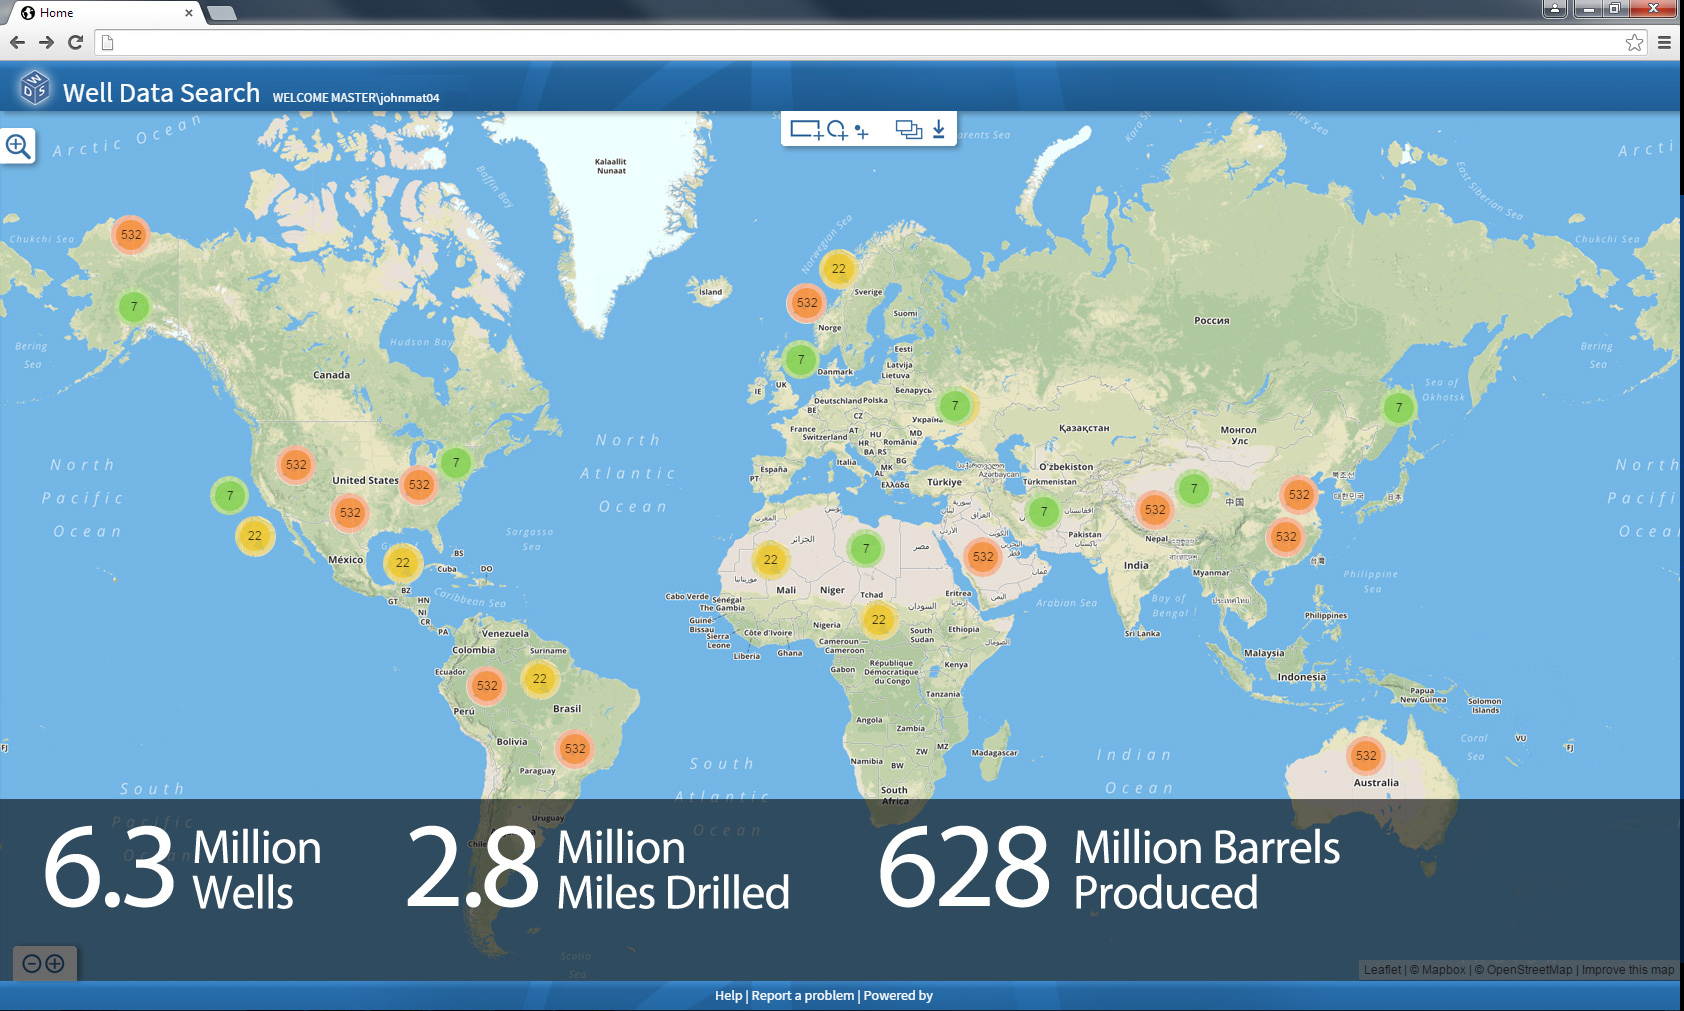
The Home screen supports analysts in map-based search of geo-referenced data. Analyst may select pan/zoom/select search tools from control at top center, or select text-based search tools from control at top left.
Footer banner is designed to provide messaging that is relevant to the logged-in user.
Basic Search
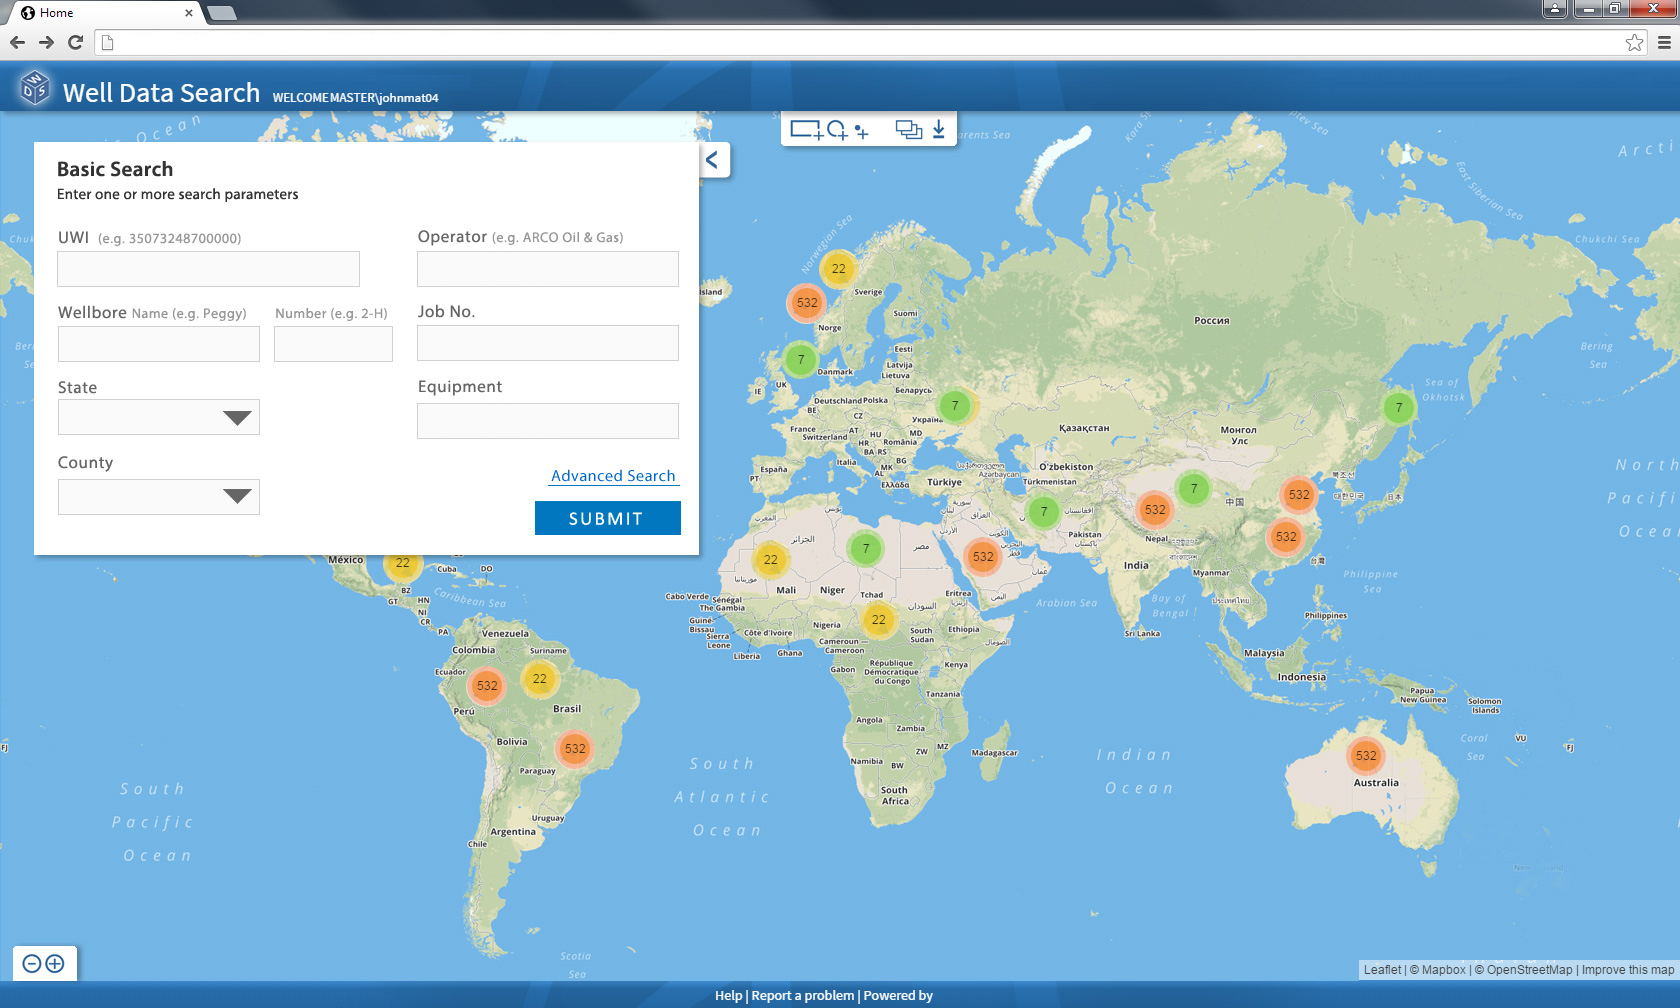
Basic Search provides data analysts with text fields for the most commonly used search parameters.
Input fields are arranged on an underlying modular grid.
Label text is clear and concise, and positioned directly above and flush left with the text field. Prompts are provided to simplify more complex text entry requirements.
Text field input areas are free of all placeholder labels. Text input areas are reserved for the user.
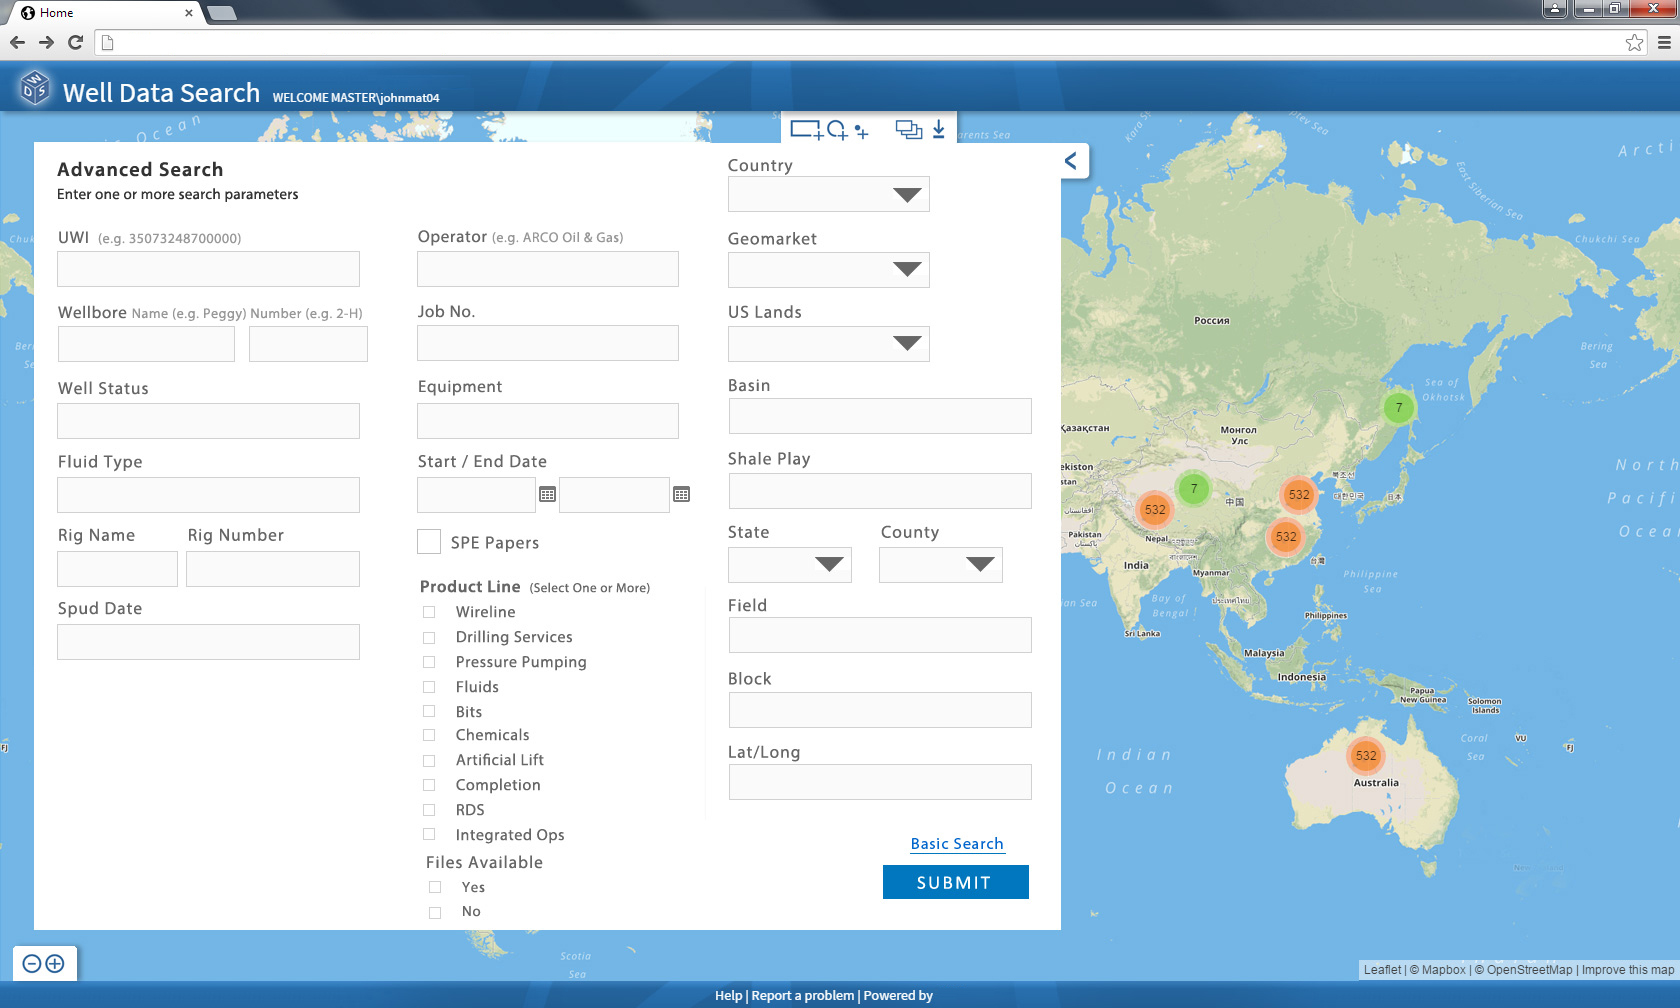
Advanced Search
Advanced and Basic Search windows are toggled using a control in the lower right of the window.
UX design standards are applied to all interfaces to ensure a consistent and familiar experience.
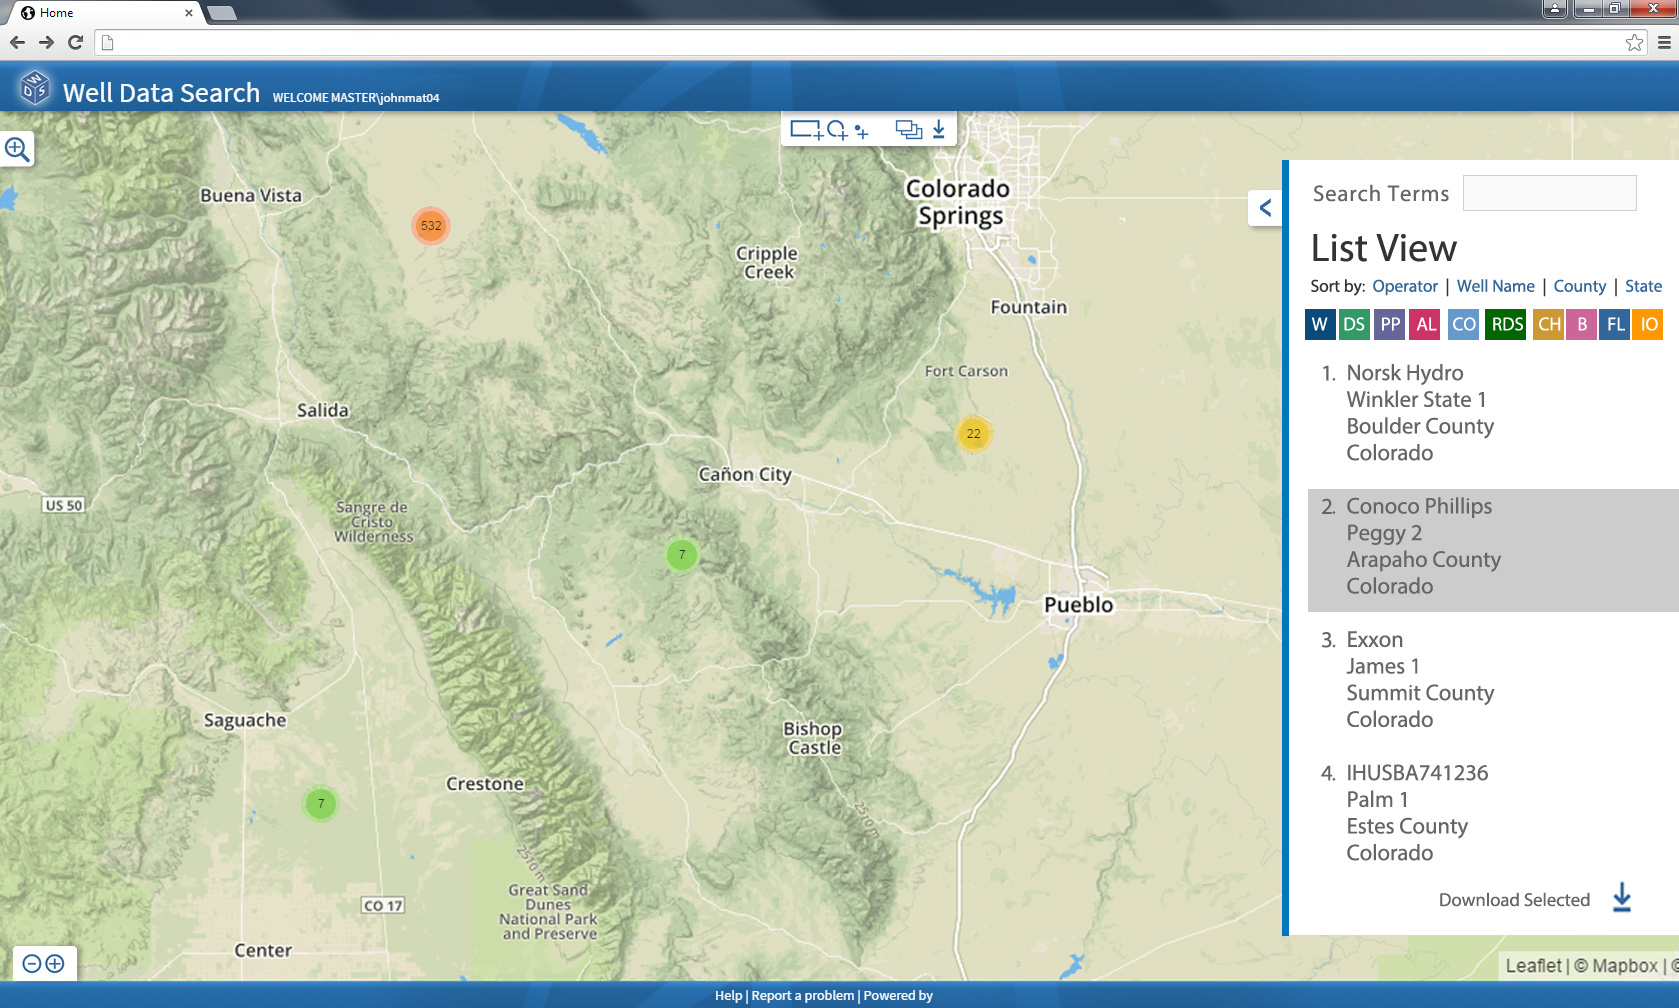
Search Results in List View
Search results shown in list format. Results can be selected and downloaded. Users may continue search using map-based controls. Events triggered via hover or click are timed to avoid unintentional activations and ensure the user has control of the interface.
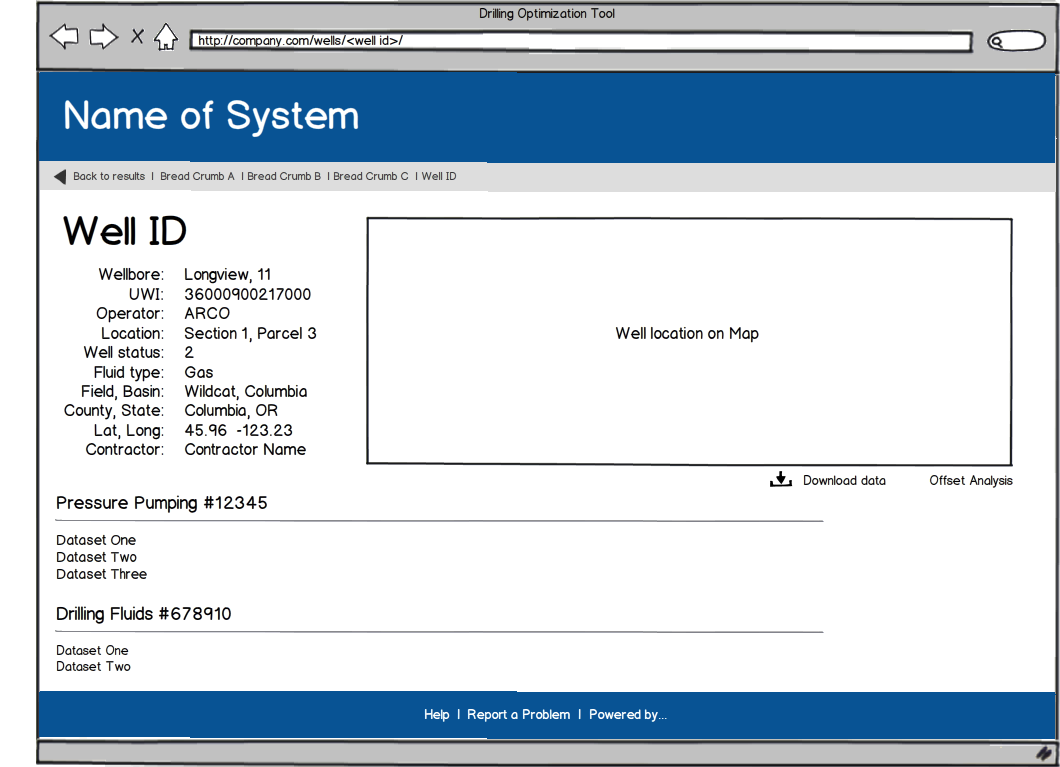
Well Data Search Wireframe
One example of the many wireframes produced in the business analysis phase of the project. For this project the team used Balsamiq for wireframing.